How to use the Fleet Performance feature in Fleet Vision mode
We know how important productivity is to your company, that is why we developed a state of the art managing system that generates data in the form of reports and statistics to help you monitor and control your fleet, and increase its productivity with just a few mouse clicks. To access Fleet Performance, open the navigation drawer by clicking on the three-dashed button at the far upper left corner of the page, under Fleet Tracking click on Fleet Performance, the following window appears.
As you can see, there are two tabs in the Fleet Performance feature; Activities and Availablity, we'll be discussing each below.
1. Activities
This tab shows you the activity of each vehicle in your fleet, specifically, when a vehicle is idle. To start, choose the "From" and "To" dates you want to view your fleet's performance at, then choose the states of the vehicle you want to show, here is a breakdown of what each status means.
1.1 Status
Click on the drop-down menu underneath "status" to show the following.Fig.02
1. New: This indicates that a vehicle has just stopped, and needs to be contacted to give a reason for stopping.2. Updated: This indicates that a vehicle has stopped, and has been contacted and gave a reason for stopping. This reason either needs to be updated after an interval of time or doesn't need regular updating. The vehicle is still idle.3. Update Required: This indicates that a vehicle has stopped, and has been contacted and gave a reason for stopping, and the interval of time for updating the reason has passed. The vehicle is still idle.4. Moved: This indicates that a vehicle has stopped, has been contacted and it gave a reason for stopping(i.e. updated) and is no longer idle.5. No Reason: This indicates that a vehicle has stopped for more than 30 minutes and has not been contacted/reached so it gave no reason for this stop, and is no longer idle.
Now choose the vehicles that you want their performance reviewed by clicking on the car-shaped button, the following window appears.
Choose the type of tracking device you have installed in your unit; vehicle, if you have the GPS module and camera if you have the Technodrive cam installed. Choose a group if any exists then mark the checkboxes next to the names of the vehicles you want to show. Click confirm and a similar window appears.
You'll find a table listing every unit in your fleet that has stopped for over 30 minutes, each unit has a name, the driver assigned to said unit, the start and end dates and times for the stop, the duration of the stop, the zone in which the unit stopped (if you have any saved zones in the system), whether the unit is loaded or not, the category (which is the reason for making that stop) and the current status of the unit that made the stop.
You'll notice the color-coding of the status of each unit, we'll review what each color means below.
Yellow: The color of the status New, Updated and Update Required. This color indicates that an action must be taken by your employee in the control room, either contact the driver to inquire about the stop made for the first time, or to re-contact the driver for an update.
Green: The color of the status Moved. This color indicates that your employee has done their job and contacted the driver of the idle unit, got the reason for the stop, and updated it on the system, it also indicates that the unit has moved after being updated.
Red: The color of the status No Reason. This color indicates that your employee hasn't taken action in regards to this unit, since it stopped for more than 30 minutes and moved without being contacted to give a reason for said stop, or that your employee hasn't updated the system with the reason for stopping before the unit started moving again.
2. Fleet Availability
This tab analyzes your data to show you statistics of your fleet's performance for the week, month, or year. It also contains several tabs for more detailed information. Once you click on the Fleet Availability tab, the following window appears.
2.1 Chart
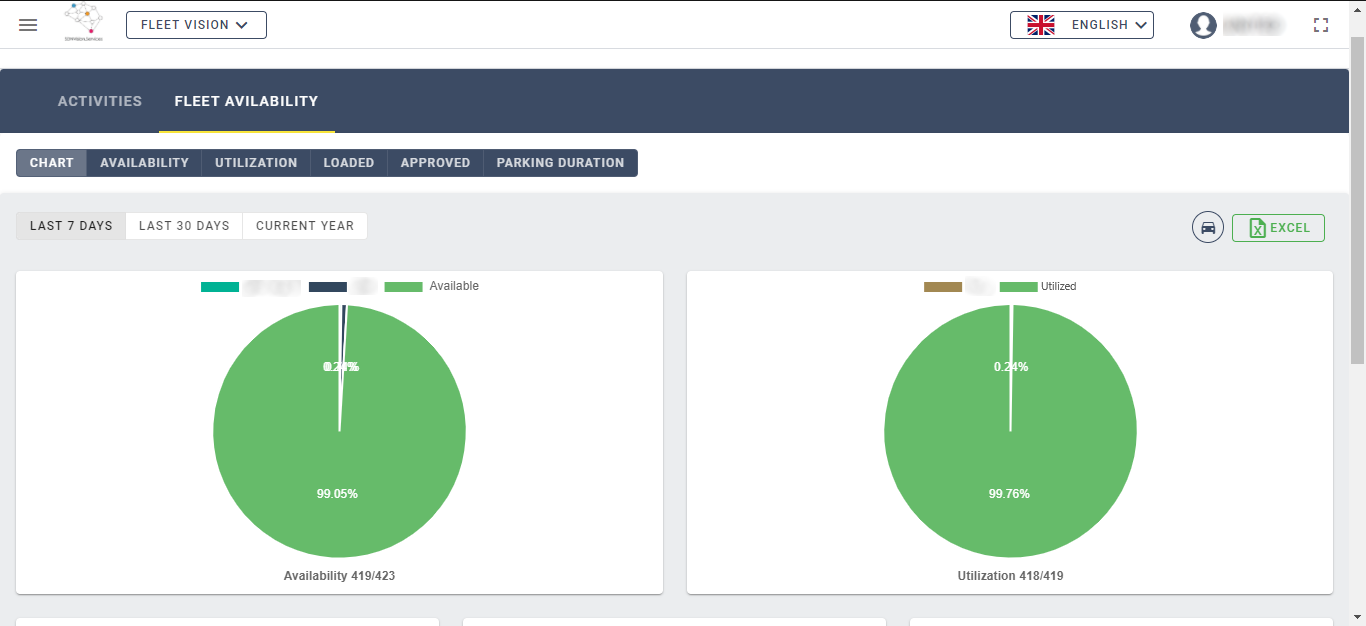 Fig.05
Essentially each chart represents a parameter of your fleet's performance, the first chart shows you the available units in your fleet as opposed to the unavailable ones (i.e. parked because they're out of service).
The second chart represents the utilized units of those available and the non-utilized ones (i.e. parked but not out of service).
To choose certain units of your fleet, click on the car-shaped button at the far right side of the page, then mark the checkboxes beside the names of the units you want to show and click confirm. Scroll down to see the rest of the charts as follows.
Each one of the previous charts has its own explanatory tab where details of the stopping units are provided in a report form, we'll discuss these tabs in the following points.

You can choose to view charted reports on the platform or you can choose to export them to an excel file by clicking on the green button with the name Excel.
2.2 Availability
This tab shows you more details about the unavailable vehicles in your fleet, to access it, under Fleet Availablity tab, click on Availability tab, a similar window appears.
You'll find all the details available in a report form; the unavailable unit's name, driver, the date of the stop, duration, the zone if any exists, and the category for stopping.
You can choose to view the reports on the platform or you can choose to export them to an excel file by clicking on the green button with the name Excel.
2.3 Utilization
This tab shows you more details about the unutilized vehicles in your fleet, to access it, under Fleet Availablity tab, click on Utilization tab, a similar window appears.
You'll find all the details available in a report form; the unutilized unit's name, driver, the date of the stop, duration, the zone if any exists, and the category for stopping.

You can choose to view the reports on the platform or you can choose to export them to an excel file by clicking on the green button with the name Excel.
2.4 Loaded
This tab shows you more details about the unutilized vehicles in your fleet, to access it, under Fleet Availablity tab, click on Loaded tab, a similar window appears.
You'll find all the details available in a report form; first, choose a filter for your data, either the Loaded units or the Unloaded units. A table with the loaded/unloaded unit's name, driver, the date of the stop, duration, the zone if any exists, and the category for stopping shows.
You can choose to view the reports on the platform or you can choose to export them to an excel file by clicking on the green button with the name Excel.
2.5 Approved
This tab shows you more details about the unutilized vehicles in your fleet, to access it, under Fleet Availablity tab, click on Approved tab, a similar window appears.
You'll find all the details available in a report form; first, choose a filter for your data, either the Approved parked units or the Unexpected Delay parked units. A table with the approved/unexpected delay unit's name, driver, the date of the stop, duration, the zone if any exists, and the category for stopping shows.
You can choose to view the reports on the platform or you can choose to export them to an excel file by clicking on the green button with the name Excel.
2.6 Parking Duration
This tab shows you more details about the unutilized vehicles in your fleet, to access it, under Fleet Availablity tab, click on Parking Duration tab, a similar window appears.
You can choose to view the reports on the platform or you can choose to export them to an excel file by clicking on the green button with the name Excel.
That concludes our overview of the fleet performance feature. If you have any more questions, please email us, call or simply start a ticket!
Related Articles
How to use the Live Tracking feature in Fleet Vision mode
Tracking your vehicles is probably the most important feature you bought our systems for, that's why we covered everything you'll ever need in the Live Tracking section on the Platform. if you're looking for a specific section, navigate to it by ...How to use the Captured Events feature in Fleet Vision mode
Captured Events tab is where you can review events taken by the TechnoDrive camera device, when an event is captured, a short clip of it is recorded and tagged with the appropriate event name then uploaded to your account on the platform in the ...How to use the Parking Types setting in Fleet Vision mode
The Parking Types setting helps you control your fleet through the Fleet Performance feature we have on our platform, the idea is to add kinds or types of parking by simply listing the reason for it, for instance, if a unit stops for scheduled ...How to use the Dashboard feature in Fleet Vision mode
Your dashboard helps you monitor and control your fleet with cool visual aids like pie charts and bar graphs, where raw data of events are processed and displayed to help you understand more about your drivers' driving behavior and whether or not ...How to use the Tracking History feature in Fleet Vision mode
Since we know tracking your fleet is one of the main reasons you bought our system, we make sure all of your fleet's raw data is processed and turned into organized and readable information that you can use in your system. The Tracking History ...